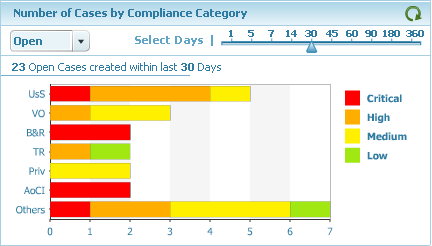
Number of Cases by Compliance Category
This chart breaks down the number of open cases into the main compliance categories. The top six categories listed are the ones with the highest number of open cases. The remaining categories are collated into the Others category.
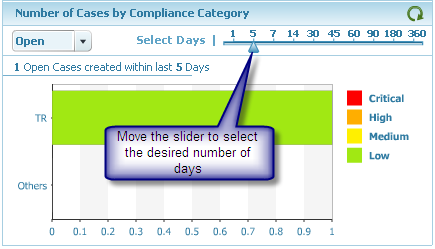
Changing Number of Days Displayed
The default view is 30 days, that is, the chart displays a breakdown of the cases that have been open for up to 30 days. To change the number of days displayed, click the arrow and move the slider to select the desired number of days (5, for example). The graph is refreshed to only report on cases created in the last 5 days.
Viewing Cases
1. Click the bar representing the category that you are interested in.
2. The View Cases screen is displayed, detailing cases created for a specific category within the number of days selected.
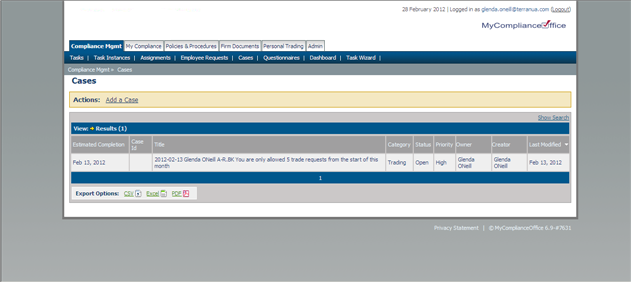
3. Click the case Title to view the case details.
4. Click the Dashboard menu option to return to the dashboard and continue reviewing the graphs.
Created with the Personal Edition of HelpNDoc: Easy EBook and documentation generator